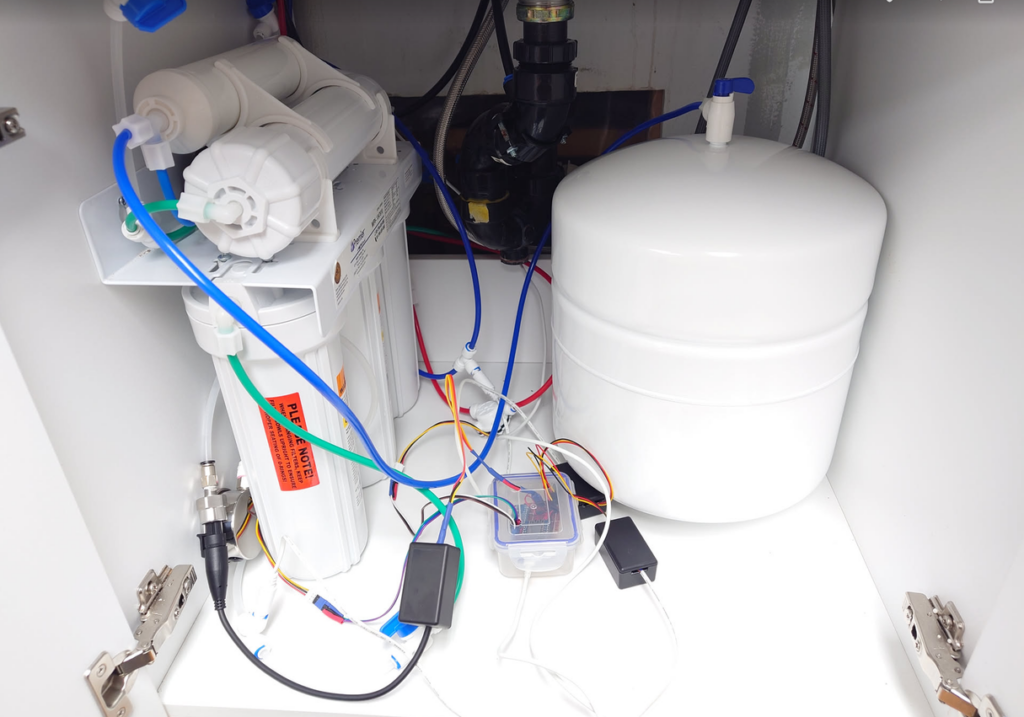
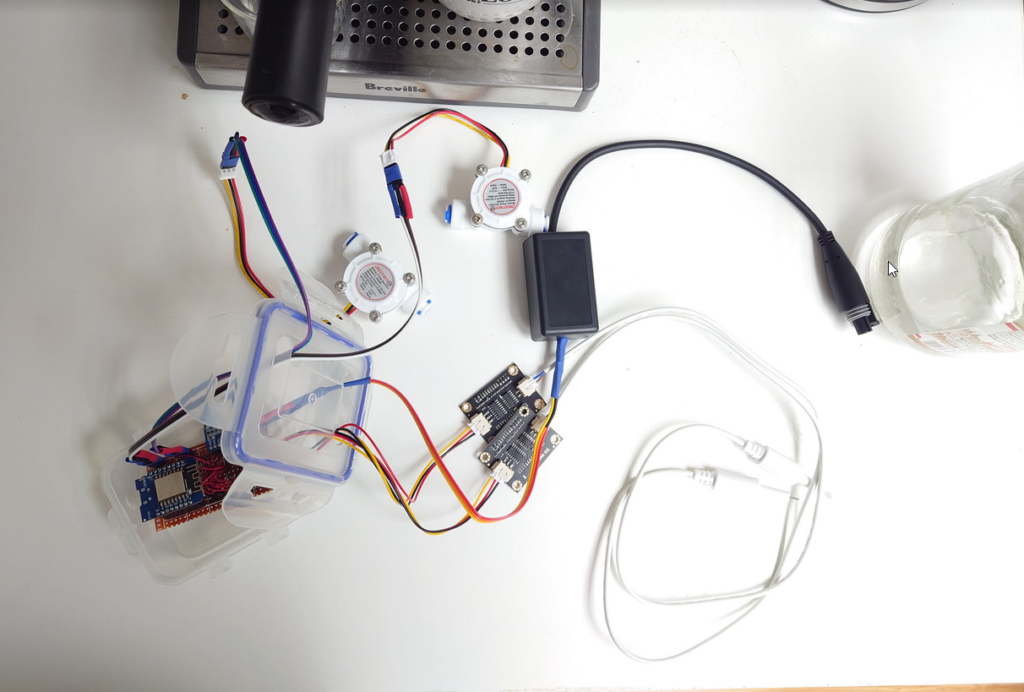
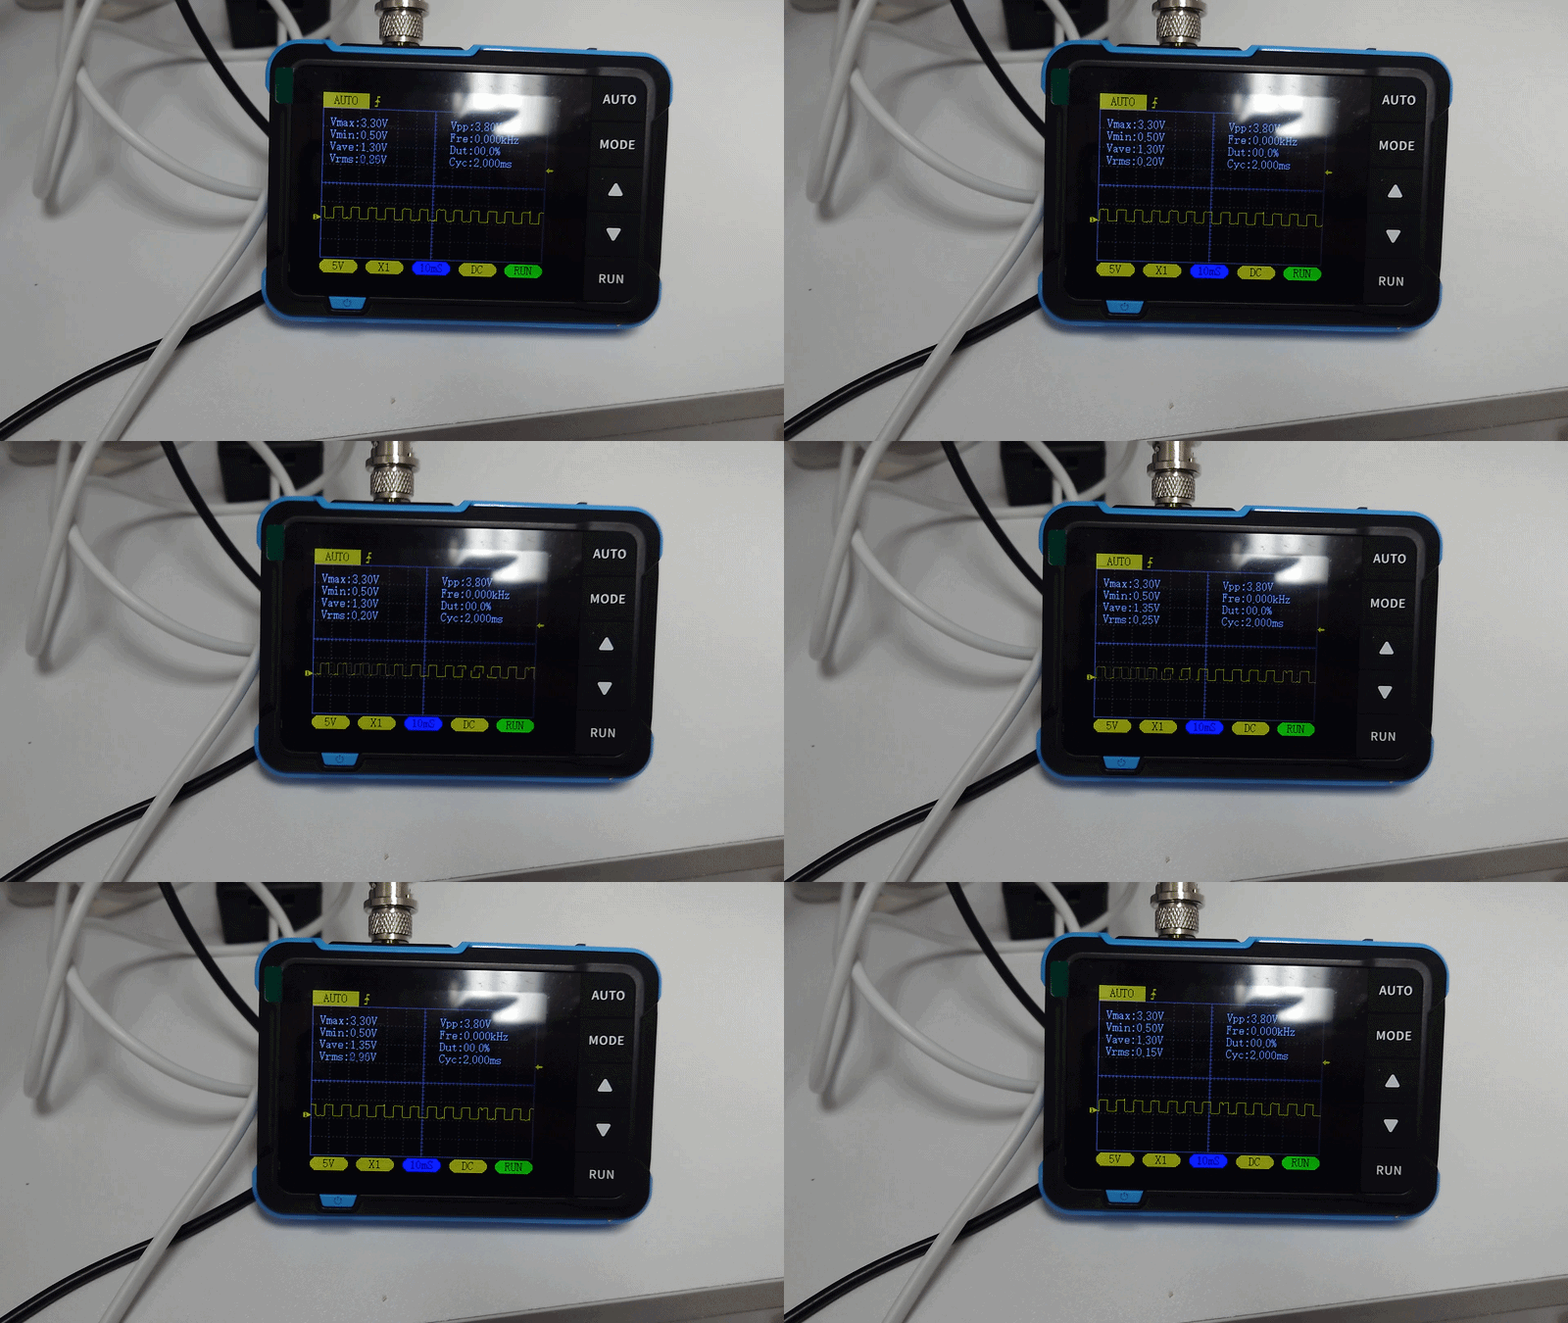
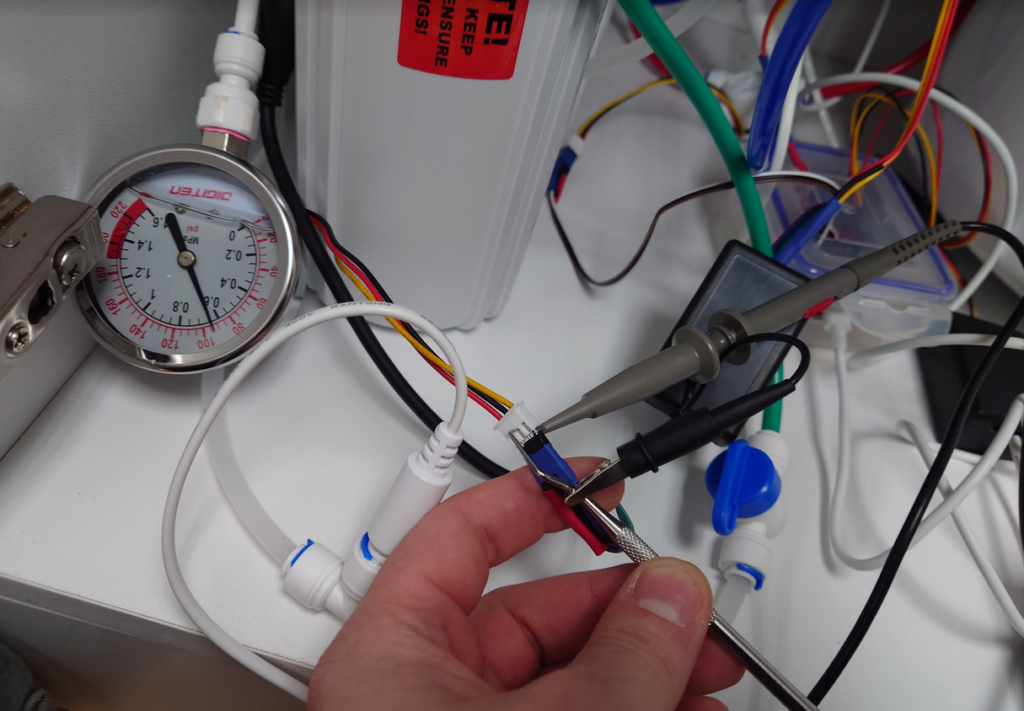
I finally setup a monitoring system for my reverse osmosis system. I have 1 pressure sensor to track mainline water pressure, 2 flow meters to track usage and efficiency and 2 TDSsensor to track concentration. This was a pretty fun project and it was the first time I was working with a pulse based water flow meter, I had to calibrate it to match the measurements I was getting in reality. I even got a good video with the oscilloscope of the pulses while the system was running. Using this to set PMs so I am back flushing and replacing filters when efficiency starts to drop.
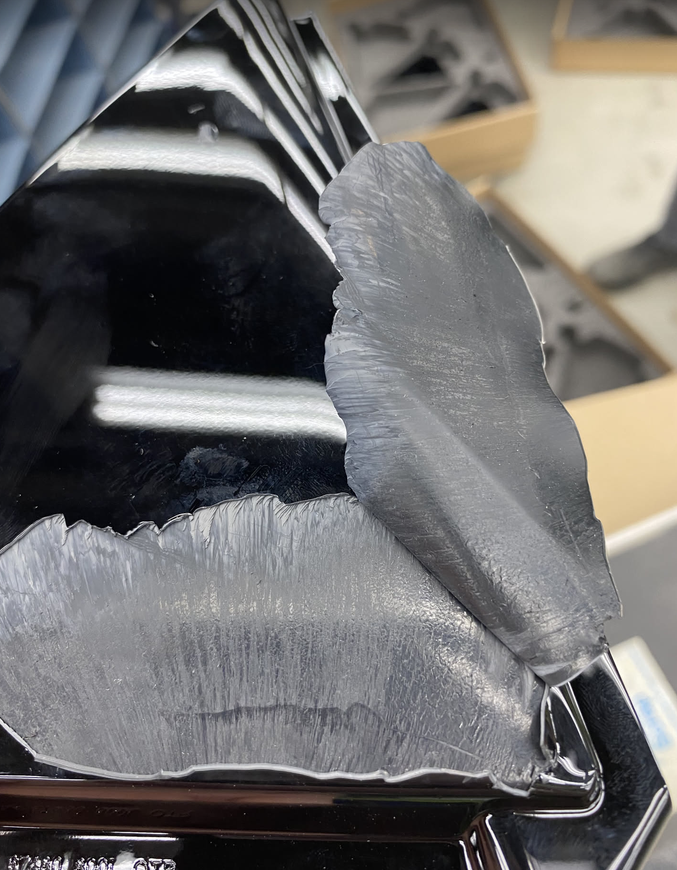
Had some production issues today where I was called for paint adhesion issues. I started looking into it and found that it wasn’t paint adhesion but rather plastic cohesion that was failing. I had a look at some other parts and was able to capture this amazing photo of complete peeling.
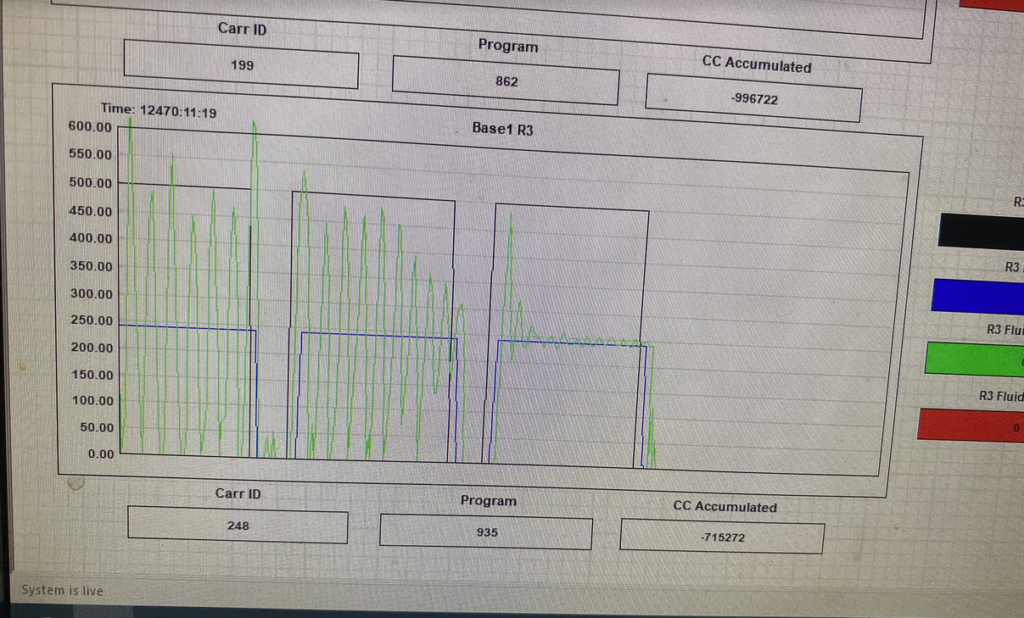
While training the new student we started having some production issues with material pulsing that made for a great teaching opportunity. We reviewed the labview monitor and saw significant instability in the flows with overly aggressive controls. During troubleshooting I was able to catch a nice screenshot that showed different control patterns in decreasing aggressiveness. Obviously we still made some adjustments to get it tuned to prevent overshooting at all.
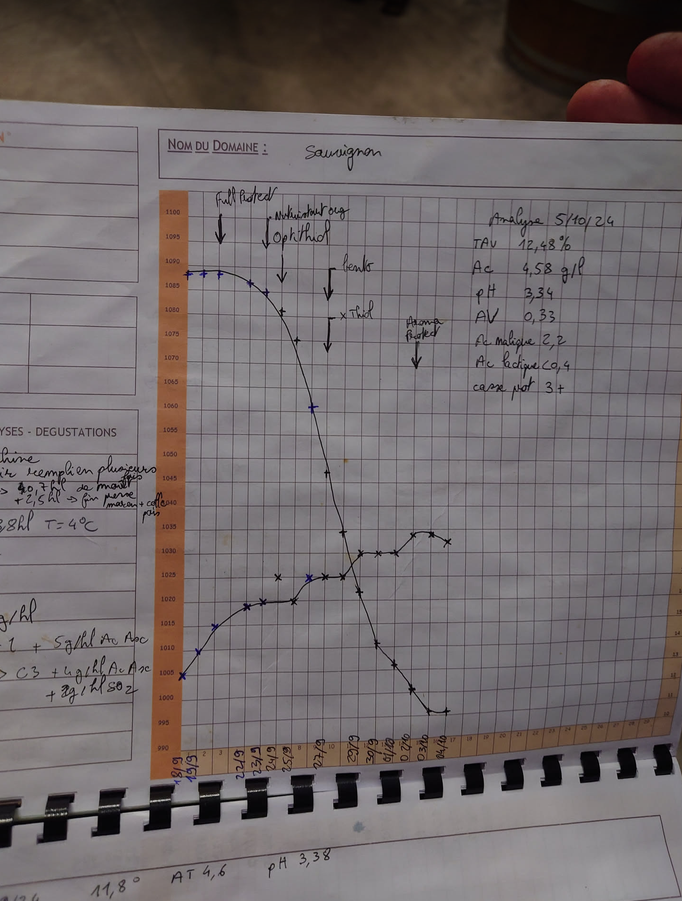
I had a great opportunity to tour a small vineyard and was able to get technical with the owner. Most the equipment was all on triclamps so it was nice to see standardization across the world. It was also the first time I was able to see a tracking sheet used to monitor fermentation progress. It was cool to see how they track specific gravity and seeing it drop as fermentation progresses. Additionally you can see all of the additions done during fermentation and the chemical analysis when fermentation finished.
One of the ways to measure furnace efficiency/life is by measuring “temperature rise” (https://hvacrschool.com/furnace-air-temperature-rise/ ) which is effectively the temperature difference between the furnace inlet and furnace exhaust. A temperature rise too low or too high can indicate issues with the furnace and monitoring this can prevent very expensive repairs.
Rather than manually testing this every X months I decided this would be a cool project to automate and set alerts for if the temperature rise ever deteriorates. I bought a couple thermocouples and wired them up to a spare NodeMcu so that I could create a wireless data logger. One thermocouple was put into the exhaust and the other plugged into the inlet. Once implemented I was able to see a 25°c temperature rise which is inline for my furnace model. Next steps are setting up automatic alerts if the temperature difference starts trending out.
This is akin to process control where rather than run equipment to failure we find the key variables (indicators) and proactively measure them to preempt any failure. In a home settings this is relatively benign but in a large manufacturing setting, a fouled heat exchanger that is unable to raise the temperature high enough can cause millions in losses.
Thermocouples plugged into air inlet and exhaustTemperature trend between the 2 thermocouplesThis is the nodemcu with the 2 thermocouples. I used a spare PCB but since the contacts on the back are exposed I had to put this in a little plastic project box so nothing shorts.This is the trend for the temperature difference between the 2 probes.
I have noticed that my water appears to run hotter in the morning when I get up vs later on in the day. In truth this is probably due to relative temperature where in the morning I am colder and so things appear warmed but I still wanted to find out how much my water temperature changed throughout the day if at all.
Looking at the temperature profile throughout the day I saw some interesting spikes that occurred like clockwork at 5am. Breaking this into minitab and looking at the temperature intervals vs hour we find that there is indeed a statistically significant difference in the morning at 5-6am vs later on.
The cause is most likely that I have my heating turn on at this time and this is likely heating up the water in the pipes leading to this rise in temperature and thus leading some credence to my theory that the water is warmer in the morning. Of note the temperature sensor is on the outside of the pipe so potentially I am seeing the warm air heat up the sensor rather than the actual water but I used thermal compound to make good contact with the pipe and it is copper after all so thermal conductivity should be good.
6 months ago I came along the desire to understand what my incoming water temperature is and how it varies over the day. As a part of this I have mounted a temperature sensor to the outside of my incoming mains water pipe and found some interesting results. Now though I understand that I am not measuring the actual internal water temperature being that this is a copper pipe I am getting a fairly close approximation.
A big result of this was my post http://192.168.2.65/data-analytics-and-finding-out-when-you-shower/ in which I investigated my ability to find when I shower based on water temperature. This is a quintessential process engineering/controls engineering problem where my desired measurable is unable to be measure and so I have to measure a separate variable that is “joined” to my required measurable and go based off that. Granted, in a big company you can buy a sensor for anything given you have the money but this is a good example for the process control on a budget.
I had an interesting theory mid year in 2022. The though being that you should be able to theoretically find out when you shower based on measuring the temperature of the water mains line (talk about shower thought).
The theory is simple, if the incoming water temperature is not at the ambient temperature (ambient being not real ambient but rather the temperature between the wall and concrete of the house), then you can tell if there is a change in flow rate by a change in temperature. This is based on the fact that if there is no flow, the water pipe temperature will reach equilibrium with the environmental temperature and any flow from this point will lead to a change in temperature.
I strapped a temperature probe to the outside of my water mains over the last 6 months to better understand this and have found very compelling results. In fact the latest trails today proved out my exact theory.
In the chart below you can see a few different stages over the morning. The first is when my heating comes on in the morning to heat up the house when I wake up (temperature set point is set to 21.5C in the morning so I wake up to a warmer house). I then started to shower at about 6:50am which resulted in an almost immediate drop in incoming water temperature leading credence to my theory. Once I finished my shower the water temperature began to stabilize again and I notice another suspected shower event where the water temperature shot down again once again leading to my theory of being able to identify showers based on water temperature.
The big learning lesson from this is that you may not always be able to measure your desired measurable but in any process there are always a lot of intertwined variables. Here we may not be able to measure direct water usage but we can measure changes in water temperature with the assumption that these are coming from large volumetric flow rates.
I have a sunroom attached to my house which is a fantastic place in the summer except it can get exceedingly hot at peak hours with temperatures reaching up to 36°C. To combat this I installed a 300 CFM exhaust fan in the roof and added a programmable timer to turn it on at peak hours.
The installation was fairly easy though I did have to manually switch the polarity on the fan to reverse the flow. I mounted it at the ceiling so it pulls the hottest air out.
Looking at the temperature throughout the day you can clearly see where the fan turns on and drops the temperature an astonishing 6°C.
Sunroom temperature throughout the dayMounted exhaust fan
This has been a pretty fun project and is a recommended solution to managing heat in sunrooms. Next steps will be setting up a controller for this to dynamically have it turn on when temperatures are too high rather than just at static times.
This will be a quick overview of my current homelab after some of the recent consolidation and upgrades.
To start off I have a custom (handmade) server rack made to hold all of the equipment. I use trays to hold auxiliary equipment such as keyboards, spare disk for quick replacement and other hardware. Plan is to move my desktop to one of these shelves on my next upgrade.
For my main workhorse I have a DELL R530 server with 8 3.5 inch bays and a 10G nic. This handles a bulk of my file store, database and processing needs. I run Proxmox as my host and various debain based distributions on my VMs.
Lastly for my switch I have a Mikrotik CSS326-24G-2S+ which has 2 SFP+ ports that can handle 10Gbps which I use for my server and workstation. For the server I use a cat 6 patch cable and for my workstation I use a fibre optic cable as cat 6 can’t handle the distance. The remaining 24 1Gbps ports are used for various devices.